
How I Use Morningstar to Quickly Check a Stock’s Financial Numbers
- Gin

- May 29
- 7 min read
Last week, I shared how you can tap into Morningstar’s investment research database to unearth investment ideas for free.
In this post, I’ll show you how I use Morningstar to quickly check a company’s financial numbers before spending hours researching a company. And definitely before buying a stock.
Because finding a company with an economic moat and a great CEO is only part of the equation. Eventually, the numbers have to prove the company isn’t all hype.

The first time I tried analyzing a company’s financials, I went straight to annual reports and 10-Ks. Huge mistake.
Reading a 10-K puts me to sleep faster than Benadryl.
I wanted a faster, easier way to spot strong businesses without drowning in accounting jargon.
And that’s where Morningstar comes in.
Its Investment Detail Report does a fantastic job of consolidating a company’s financial numbers onto a single page. This is a huge time-saver, and there’s a great chance you can access this report with your free Morningstar subscription through your public library.
HOW TO ACCESS MORNINGSTAR’S INVESTMENT DETAIL REPORT
To find the Investment Detail Report, pull up any publicly traded company in Morningstar’s database using your preferred method.
Click on the Download Report(s) button in the top right corner of the screen. It looks like a downward-facing arrow.
Choose Investment Detail Report.

USING THE INVESTMENT DETAIL REPORT
If you’re new to stock analysis, don’t be scared by the wall of numbers staring back at you in the Investment Detail Report. At a closer glance, you’ll see that the numbers are actually organized very well. Plus, it contains the last 10 years’ worth of financial numbers all on one page, which is often hard to find.
WHAT TO LOOK FOR IN THE FINANCIAL NUMBERS
Ideally, you want to see these numbers steadily rising over time—not bouncing around wildly from year to year.
Nobody can predict the future perfectly. But companies with stable financials are usually easier to understand—and easier to trust.
It’s like if you were to loan money to a person, would you feel more secure in loaning money to someone who earns a steady paycheck or to someone whose monthly income is unpredictable?
Personally, I like seeing double-digit growth over both shorter and longer periods. That usually tells me the business still has momentum.
And over time, stock prices tend to follow earnings. So if a company keeps growing its profits year after year, there’s a good chance the stock price eventually follows too.
THE FINANCIAL NUMBERS I CHECK FIRST
Morningstar throws a mountain of numbers at you, but thankfully we don’t need to analyze every microscopic detail like we’re auditioning to become Warren Buffett’s accountant.
Revenue: The money a company brings in from selling products or services. Also referred to as sales.
Earnings Per Share (EPS): The profit (net income) a company makes per individual share of stock. Companies that are losing money would have a negative EPS.
Book Value Per Share (BVPS): What each share would theoretically be worth if the company sold all its assets and paid off all its debts.
Operating Cash Flow: The amount of cash coming in from day-to-day operations. The more cash a company brings in, the less it has to rely on borrowing.
Free Cash Flow: The leftover cash from operations after paying expenses needed to keep operations going. The company can use this cash to pay dividends, pay down debt, or expand the business.
Return on Equity (ROE): Measures how efficiently management turns shareholder money into profit. For example, a 15% ROE means the company generates $15 in profit for every $100 invested by shareholders.
None of these numbers should be viewed in isolation, but they can quickly tell you whether a company deserves deeper research.
WHAT GOOD STOCK FINANCIAL NUMBERS LOOK LIKE: GOOGLE
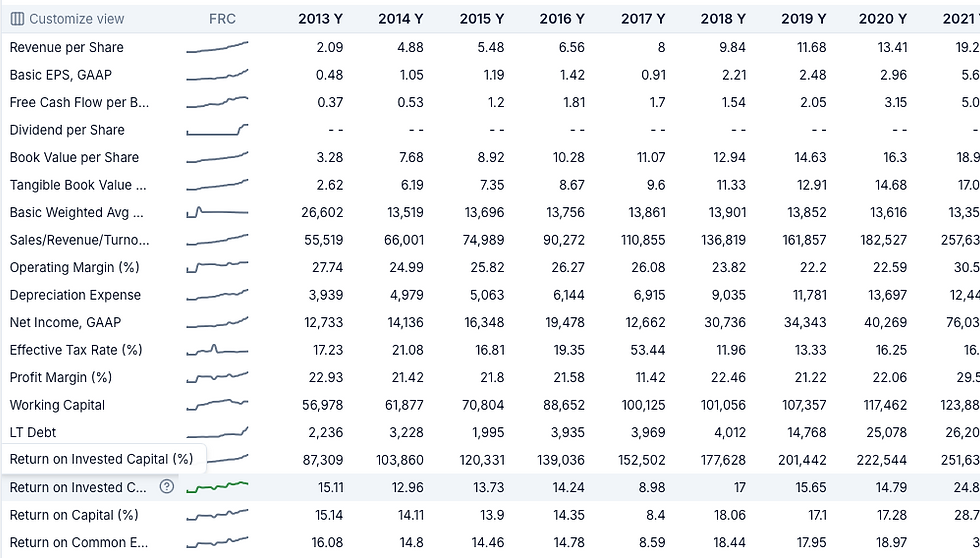
Google is a good example of a company with a moat and smooth growth. We can see that Revenue, EPS, BVPS, Operating Cash Flow, Free Cash Flow, and ROE all steadily rise from 2016 to 2025.

A few numbers dip briefly in 2017 and 2022, but the overall trend still points clearly upward. If you were to plot the numbers on a line graph, the line would be fairly straight and rising.
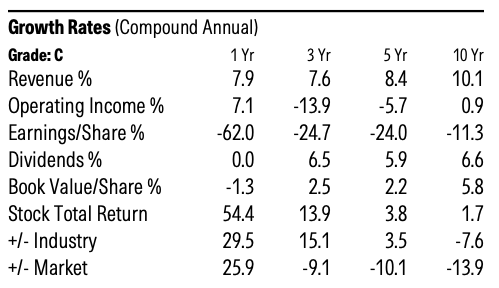
But how quickly are they growing? For that, we can check the Growth Rates section on the left side of the page.

Morningstar has already calculated compounded annual growth rates for 1-, 3-, 5-, and 10-year terms. Here we see that Revenue, EPS, and BVPS have all seen double-digit compounded growth. Moreover, EPS and BVPS have been growing faster in recent years, which is fantastic.
Growth rates for Operating Cash Flow and Free Cash Flow aren’t listed, but that can easily be checked with a growth rate calculator. Plugging in the numbers, I see that the 1-, 5-, and 10-year growth rates for Operating Cash Flow are 31.5%, 15.8%, and 18.4%, respectively.
Free Cash Flow hasn’t grown much in recent years, but I know that Google started to pay out dividends beginning in 2024, which is one thing Free Cash Flow is used for. Google may have also used that cash to pay down debt or expand the business. You’d have to check the annual reports to find out what the cash was used for.
Still, Google has a very high Free Cash Flow, and over the 10-year period, it grew 12.3%. Those numbers are good to see.
Now, let’s take a look at some bad numbers.
WHAT BAD STOCK FINANCIAL NUMBERS LOOK LIKE: CVS
CVS is a good example of a company with no economic moat, and its numbers reflect that.

Revenue is growing at less than 8% annually, and BVPS has pretty much stopped growing in recent years. All the other numbers—EPS, BVPS, Operating Cash Flow, Free Cash Flow, and ROE—swing up and down each year. Sometimes, the numbers even go into the negative.
If you plotted these numbers on a graph, the result would look more like a roller coaster than a steady climb. This is the opposite of what we want.
WHY I ALSO CHECK RETURN ON INVESTED CAPITAL (ROIC)
There’s one other useful financial number I like to check that can’t be found on Morningstar’s Investment Detail Report—Return on Invested Capital (ROIC).
One of a CEO’s biggest jobs is deciding what to do with the company’s money. Should they pay down debt? Expand the business? Buy another company? Sit on cash and wait for a better opportunity?
Not every available dollar has to be used. Some of it may sit idly as cash until a good use can be found later.
But when a CEO does use it, I want to be sure they’re doing so to make the company stronger and more valuable—especially when it comes to the money supplied by investors.
That’s basically what ROIC tells us: how good management is at turning invested money into profits.
Ten-year ROIC numbers can be hard to find online, but I recently found a website that supplies it.
Search for a company by name or ticker symbol on ROIC.ai. Near the bottom of the first box, look for Return on Invested Capital.
Google shows ROIC numbers in double digits for all years except for 2017. In the past five years, ROIC even rose above 20%, which is a really good sign. This suggests the company is using its capital wisely.
WHAT TO AVOID WHEN ANALYZING A STOCK’S FINANCIAL NUMBERS
The information Morningstar provides is extremely helpful, but it’s not foolproof. There are a few things to be careful of.
NOT ENOUGH HISTORICAL DATA
It’s best to stay away from companies that don’t have at least 10 years’ worth of financial numbers. It takes at least 10 years to start to see patterns.
Remember, we want consistency and reliability. Companies that only have a few years’ data haven’t been proven yet.
The myth that you have to buy into a stock very early on to make a profit is just false. All of my profitable investments came with companies that were in business for many years.
On the flip side, I can share one really bad investment I made with a young, unproven company.
In 2020, I bought about $20,000 worth of stock in Zoom. It wasn’t that I thought Zoom was a great company with a moat. Honestly, I was just bored and going stir-crazy at home during the pandemic.
At the time, Zoom had less than four years of financial numbers. The data was spotty; there wasn’t enough information to see any type of stable pattern.
This turned out to be the stupidest investment I ever made; I lost 90% of my money. Actually, it’s hard to even call it an investment. In retrospect, it was really just a gamble.
Had I waited 10 years, I definitely would’ve never bought the stock because the numbers still look ugly.
DON’T RELY ON FINANCIAL NUMBERS ALONE
Great financial numbers are just one piece of a company’s story. It’s still important to do additional research into a company before buying a stock.
A company can look amazing on paper while hiding serious problems beneath the surface. That’s why I still check for things like an economic moat, strong leadership, and whether the business itself actually makes sense to me.
FAQ
WHAT DOES NEGATIVE FREE CASH FLOW MEAN?
Negative cash flow simply means the company is spending more cash than it’s bringing in, which is not always a bad thing. Young companies often have negative free cash flow because they’re spending aggressively to grow quickly. Sometimes, however, the reason could be a problem with the business itself. That’s why it’s important to find out where the cash is going.
WHAT IS A GOOD ROE AND ROIC?
Personally, I look for an ROE of 15% or higher. ROIC is usually a little lower than ROE, so I look for at least 10%.
SHOULD A COMPANY BE AVOIDED IF THE NUMBERS WENT DOWN A YEAR OR TWO?
It’s hard to find a “perfect” company. Even great companies can have a bad year here and there. But if it’s part of a long-term downward trend, it could be a sign of the moat drying up, so do your research.
FINAL THOUGHTS
No single number can guarantee a great investment. Even companies with fantastic financials can run into trouble.
But learning how to quickly check a company’s financial numbers can dramatically improve your odds of making better investing decisions.
Instead of blindly buying stocks based on hype, headlines, or Reddit posts, you can start looking for businesses with real financial strength behind them.
And honestly, that already puts you ahead of most investors.
See you at the finish line!
Disclaimer: The content on this blog is for informational and educational purposes only and reflects my personal experiences and opinions. I am not a licensed financial advisor, accountant, or attorney. Nothing on this site should be considered financial, legal, or tax advice. While I strive to provide accurate and up-to-date information, I make no guarantees of any kind regarding the completeness, accuracy, or reliability of any information presented. Always do your own research and consult with a qualified professional before making any financial decisions. By using this site, you agree that I am not responsible for any actions you take based on the information provided here.


Comments